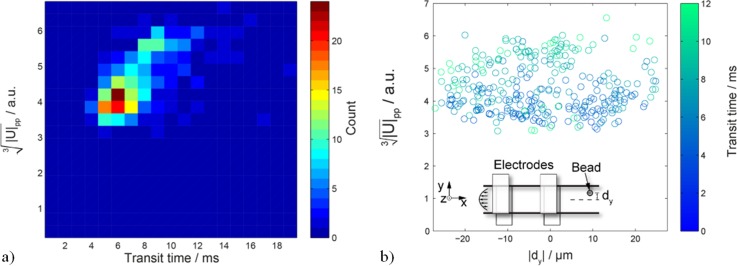
FIG. 7.
(a) Density plot of vs. transit time for 10 μm beads. (b) versus y-position in channel with color-coded transit time. Inset: schematic of the measurement. There is no observable variation in y-direction. The slower beads causing higher signals in (a) can be explained by beads flowing near the top or bottom of the channel (closer to the electrodes).

