
Figure 3.
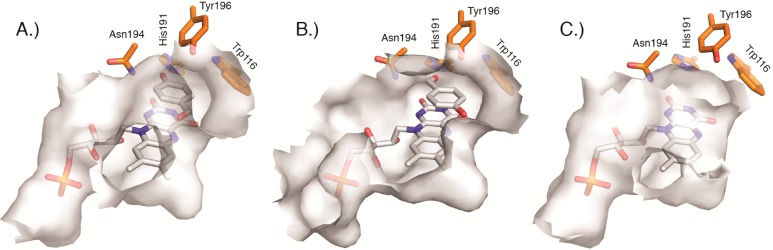
Comparison of active site binding pockets for (A) OYE1 (PDB: 1OYA), (B) cpOYE303 (PDB: 4RNU), and (C) cpOYE154 (PDB: 4RNX). Gray-shaded surfaces mark the interior protein surface. Key amino acids in the active sites (W116, H191, N194, and Y196) are orange. The bound FMN cofactor and substrate analog HBA (present in A and B) are shown as white sticks.