
Fig. 3.
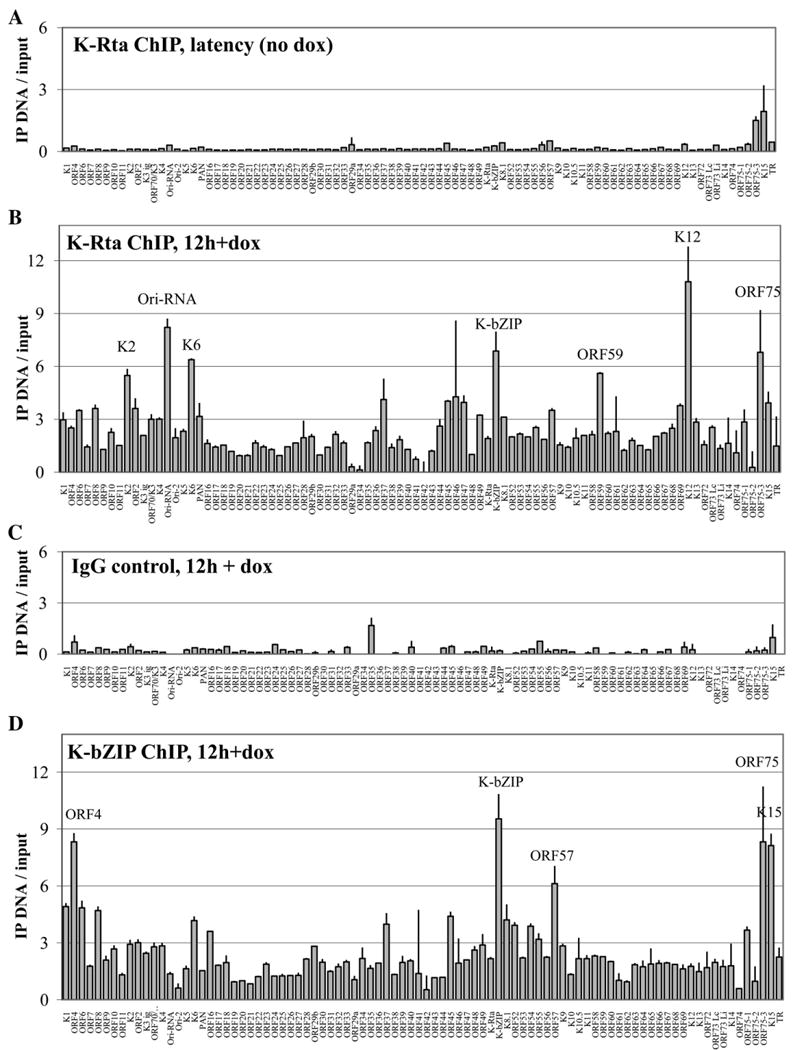
Genomewide promoter association profiles for K-Rta and K-bZIP in TREx BCBL1-Rta cells. Normalized background-subtracted Cy3–Cy5 ratios of linear-amplified IP-DNA over input DNA are shown with standard deviations determined by paired replicate spots. (A) K-Rta promoter occupancy in latent cells with no doxycycline addition. (B) K-Rta distribution at 12 h after induction with dox. (C) Control IgG ChIP-on-chip for 12-hour induced cells. (D) K-bZIP association at 12 h after induction with dox. Promoters are ordered by genomic position; all fragments which were enriched greater than 5-fold are labeled for clarity.