
Figure 11.
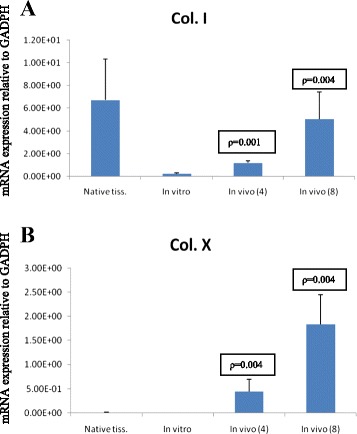
Comparison between in vivo constructs (4 and 8 weeks) to in vitro for the quantitative RT-PCR analysis ( p < 0.05) of gene expression of collagen type I (A) and collagen type X (B). Native isolated RNA from normal native cartilage.
Official websites use .gov
A
.gov website belongs to an official
government organization in the United States.
Secure .gov websites use HTTPS
A lock (
) or https:// means you've safely
connected to the .gov website. Share sensitive
information only on official, secure websites.
Comparison between in vivo constructs (4 and 8 weeks) to in vitro for the quantitative RT-PCR analysis ( p < 0.05) of gene expression of collagen type I (A) and collagen type X (B). Native isolated RNA from normal native cartilage.