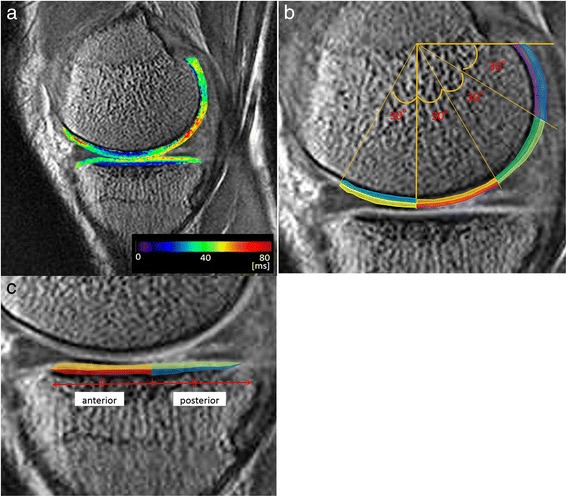
Figure 1.

Assessment of T1ρ values in the articular cartilage. a. Colored T1ρ mappings of femoral and tibial articular cartilage. b. Regions of interest (ROIs) were divided into eight regions on the femoral articular cartilage; superficial (−30°–0°): yellow; deep (−30°–0°): cyan; superficial (0°–30°): red; deep (0°–30°): orange; superficial (30°–60°): yellow-green; deep (30°–60°): green; superficial (60°–90°): blue; deep (60°–90°): purple. c. ROIs were divided into four regions on the tibial cartilage; superficial (anterior): orange; deep (anterior): red; superficial (posterior): yellow-green; deep (posterior): blue.
