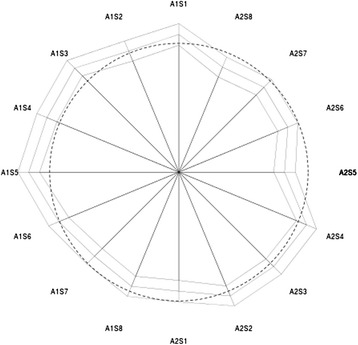
Figure 1.

Star plot of fitted means at time 0 (middle polygon) with lower and upper 95% confidence limits (inner and outer polygon). Dashed circle shows overall mean. Schematic diagram of the sensor layout; A = Array, S = Sensor. Sensors located in the area of overlap of the cuff (A1S1-3) showed significantly higher pressure values than the anteromedially positioned sensor A2S8.
