
Fig. 2.
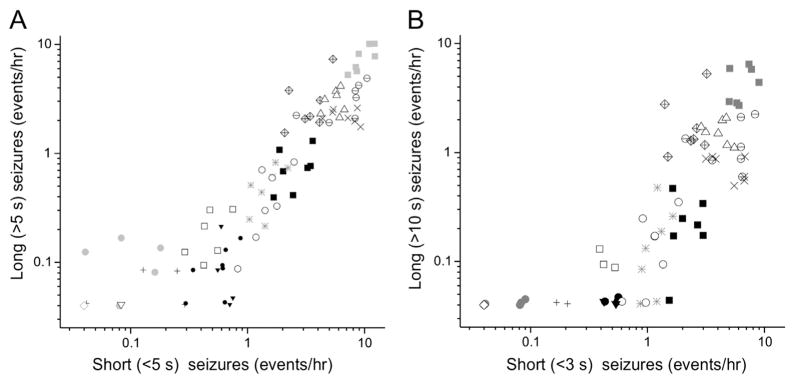
The frequencies of short and long seizures are highly correlated. The frequencies of long seizures are plotted as a function of the frequencies of short seizures, as observed with the full montage in 7 consecutive non-overlapping 24 h recordings from 16 epileptic rats. Individual rats are indicated by different plotting symbols (up to 7 points per rat). A) Short and long seizures were defined as lasting up to 5 s and longer than 5 s, respectively. The correlation between their frequencies (r = 0.94, n = 17; p < 10−5; Pearson). B) Short and long seizures were defined as lasting up to 3 s and longer than 10 s, respectively. The correlation between their frequencies remains highly significant (r = 0.88, p < 10−5; Pearson).