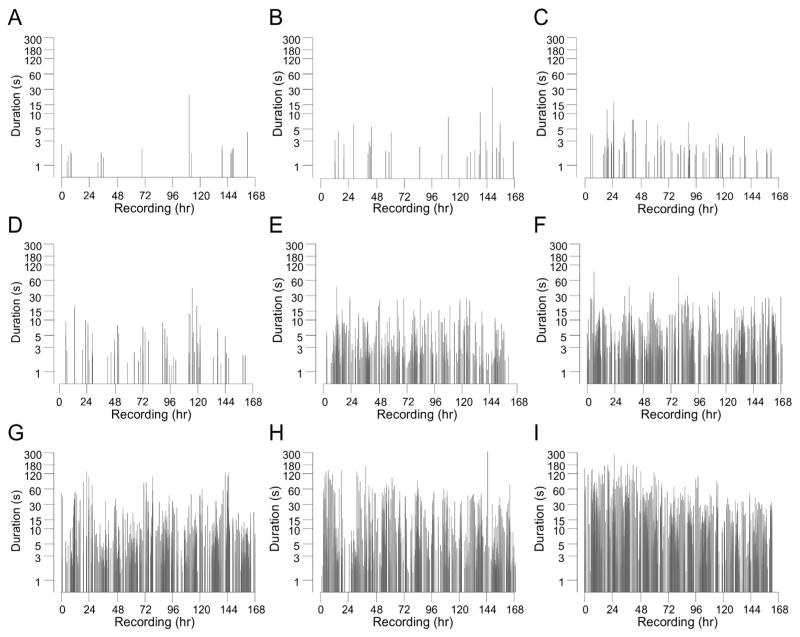
Fig. 3.
Rat-to-rat and temporal variability of ictal activity a month after rpFPI. Duration of seizures, as observed by the full montage, plotted by their chronology during 1 week of continuous recording for 9 representative rats with seizure frequencies ranging from 0.1 seizures/h (A) to 17.4 seizures/h (I). The effect of duration-based seizure definitions on the apparent frequency and temporal pattern of ictal activity can be visualized by focusing on the region above any selected criterion duration on the y-axis. Note the circadian clustering in A, D.

