Fig. 2.

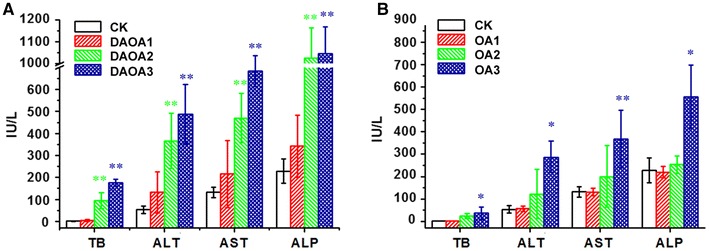
Serum TB, ALT, AST and ALP profiles of mice. a DAOA b OA. Each value represents the mean ± S.D. of ten mice per group. *Significantly different from CK group (P < 0.05); **Significantly different from CK group (P < 0.01)

Serum TB, ALT, AST and ALP profiles of mice. a DAOA b OA. Each value represents the mean ± S.D. of ten mice per group. *Significantly different from CK group (P < 0.05); **Significantly different from CK group (P < 0.01)