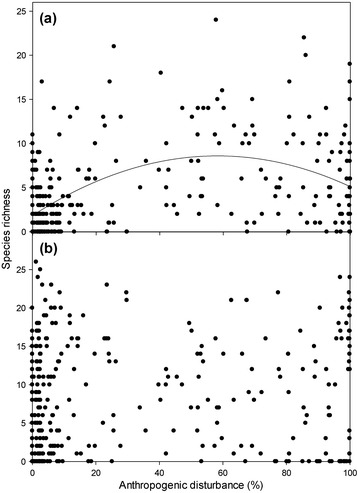
Figure 3.

Species richness of generalists and specialists relative to percent anthropogenic disturbance extent. (a) The 50 most ‘generalist’ species observed (y = 0.00199x2 + 0.232x + 1.855, R2 = 0.242, p < 0.001), and (b) the 50 most ‘specialist’ species (y = 0.000922x2 + 0.0970x + 7.177, R2 = 0.010, p = 0.050). Best fit polynomial regression line shown in (a), no ecologically significant trend for (b).
