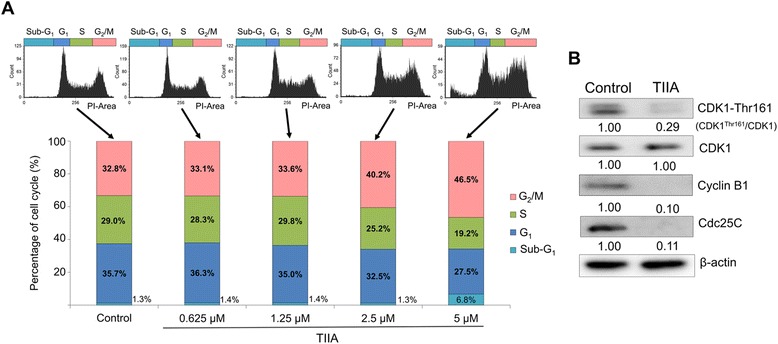
Figure 5.

TIIA induces cell cycle arrest at the G 2 /M transition in AGS cells. (A) Flow cytometric analysis shows the distribution of DNA content in AGS cells after 48 h of TIIA treatment. Cellular DNA was stained by PI and analyzed to quantify the percentage of cells in certain cell cycle phases using FCS Express 4. The percentage of AGS cells in the G2/M phase transition increases along with increases in TIIA treatment concentrations, exhibiting a dosage-dependent relationship. The percentage of cells in the sub-G1 phase also increases, from 1.3% (control) to 6.8% (5.3 μM TIIA), suggesting the occurrence of apoptosis. (B) Protein levels of Phospho-CDK (Thr 161), total CDK, cyclin B1 and Cdc 25C were analyzed using western blotting. β-actin was used as an internal control.
