
Figure 5.
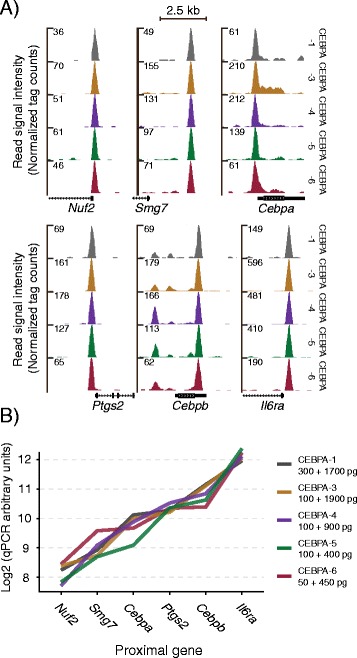
Test of pico-scale ChIP-seq amplification linearity. (A) CEBPA profiles of promoter regions of six known CEBP targets. (B) qPCR validation of linearity. Amplicons positioned in CEBPA peak regions from A. ChIP-DNA (left) and bacterial carrier DNA (right) amounts indicated.