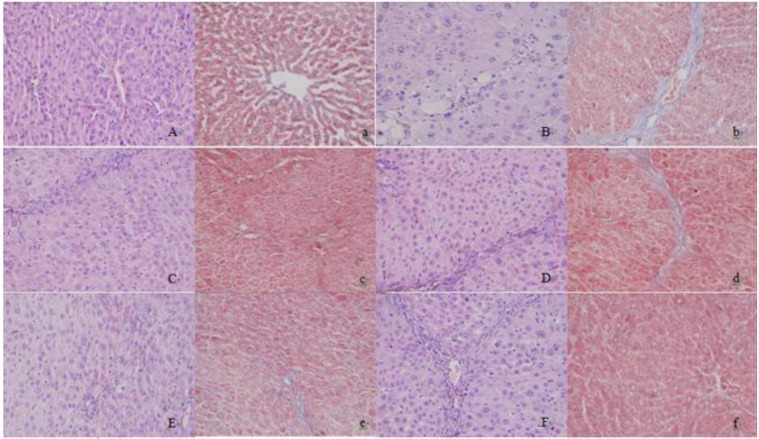
Figure 1.
Histopathological changes of liver tissues in hepatic fibrosis rats (HE, Masson, × 200). A, a: normal group; B, b: model group; C, c: petroleum ether extract treatment group; D, d: ethyl acetate extract treatment group; E, e: n-butyl alcohol extract treatment group; F, f: positive drug group (A-F: HE staining; a-f: Masson staining)

