
Figure 4.
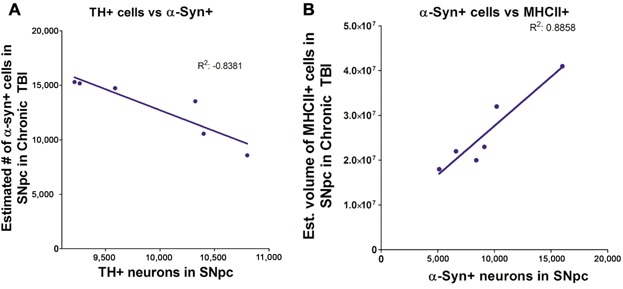
Correlation of TH-positive expression vs. α-synuclein overexpression and MHCII+ cells vs. α-synuclein. Mean estimated number of α-synuclein expressing neurons negatively correlates (A) with the number of TH-positive neurons in the SNpc ipsilateral to TBI (Pearson r = −0.9115, R2 = −0.8381, P < 0.01). Mean estimated number of α-synuclein expressing neurons positively correlates (B) with the volume of MHCII+ cells in the SNpc ipsilateral to TBI (Pearson r = 0.9412, R2 = 0.8858, P < 0.01). Significance at P's < 0.05.