
Figure 5.
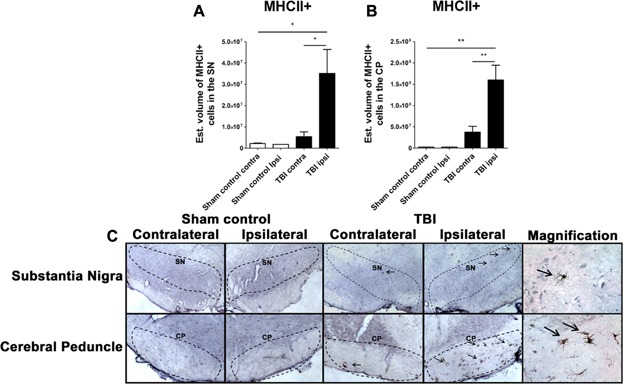
Upregulation of MHCII+ microgia cells in the SN and CP in chronic TBI rats. Quantification of MHCII immunostaining reflects mean estimated volume of MHCII+ activated microglia cells in the SN and CP in the contralateral and ipsilateral side (A, B). SN, F3,2 = 7.951; P < 0.001; CP, F3,2 = 16.18; P < 0.0001. Arrows indicate MHCII+ activated microglia cells ipsilateral SN and CP from TBI injury. Photomicrographs correspond to representative SN in coronal sections immunostained with MHCII/OX6 antibody. (C) Top part left: SN, sham control (contralateral, ipsilateral, and magnification); top part right: SN, TBI (contralateral, ipsilateral, and magnification); bottom part left: CP, sham control (contralateral, ipsilateral, and magnification); bottom part right: CP, TBI (contralateral, ipsilateral, and magnification); scale bar = 100 μm, magnification = 1 μm. Significance at P's < 0.05.