Figure 1.

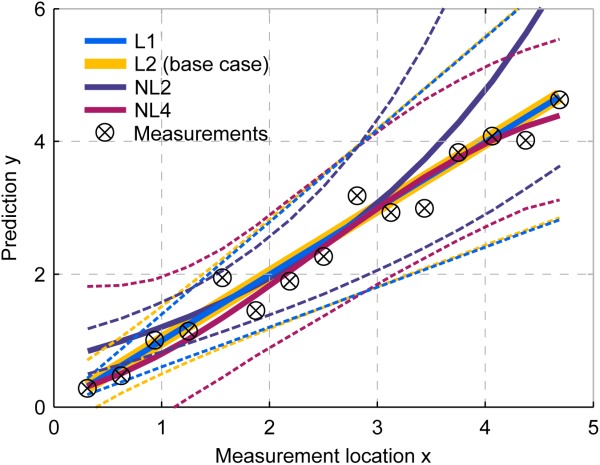
Synthetic test case setup. Measurements marked in black, prior estimate of linear (L1, L2) and nonlinear (NL2, NL4) models in solid lines, 95% Bayesian prediction confidence intervals in dashed lines of the respective color.

Synthetic test case setup. Measurements marked in black, prior estimate of linear (L1, L2) and nonlinear (NL2, NL4) models in solid lines, 95% Bayesian prediction confidence intervals in dashed lines of the respective color.