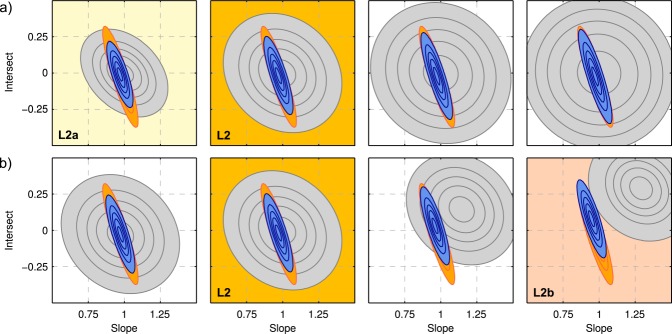
Figure 2.

Prior densities (gray), likelihood (orange), and posterior densities (blue) for the different scenarios of the synthetic test case. Contour lines represent 10–90% Bayesian confidence intervals: (a) variations of prior width (fractions of base case variance shown here: 0.5,…,5), (b) variations of prior/likelihood overlap (distance between prior mean and MLE shown here: 0,…,0.3).
