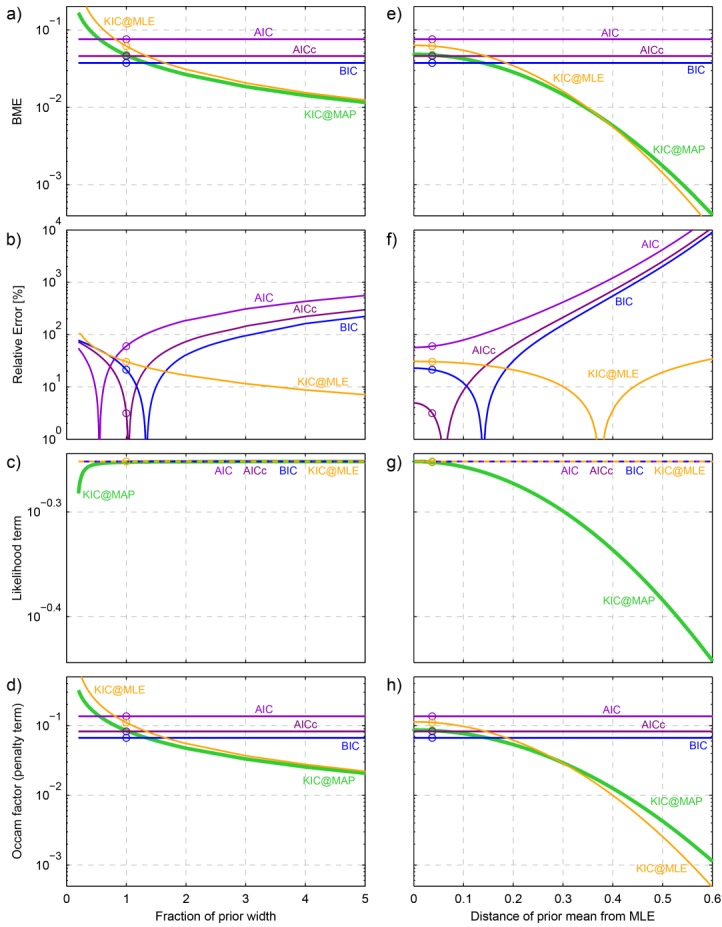
Figure 5.

(left) Results obtained for the synthetic test case as a function of prior width and (right) as a function of distance between prior mean and MLE. (a and e) Approximation of BME, (b and f) relative error with respect to the analytical solution, (c and g) likelihood term approximation, (d and h) Occam factor approximation. The result obtained from KIC@MAP represents the analytical solution in this case.
