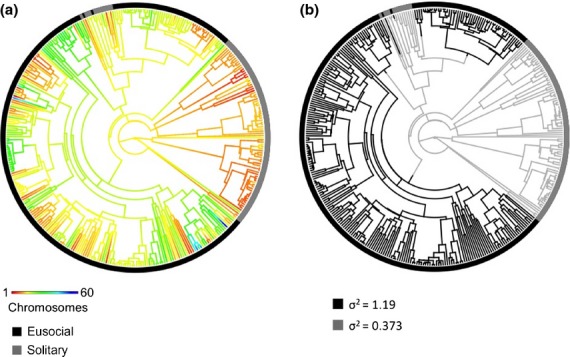
Figure 2.

Analysis of chromosome number evolution rate. In both trees, the ring outside of the tree indicates the sociality state of the terminal taxa, black indicating eusocial and grey indicating solitary. (a) The branches have been painted to illustrate a reconstruction of the evolution of chromosome number under Brownian motion according to the scale at lower left. (b) A single stochastic mapping from our analysis shows how the branches were assigned to either eusocial or solitary states. Values for σ2 are the mean across 100 stochastic mappings and represent the rate of chromosome number evolution.
