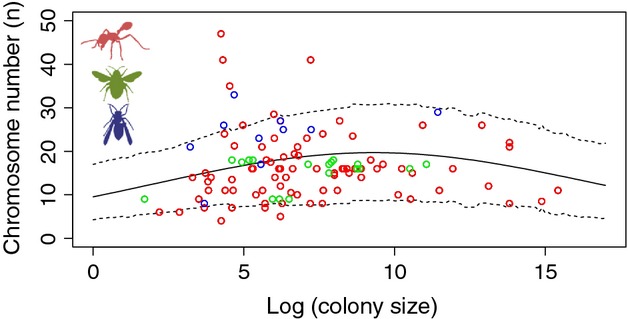
Figure 3.

The correlation between chromosome number and colony size. The open dots show the raw data, whereas the solid lines show the model estimation from a phylogenetic mixed model in MCMCglmm generated using the ‘predict’ function. The dotted lines show the 95% credibility interval around the estimates. Data from different taxonomic groups are colour-coded (ants = red, bees = green and wasp = blue).
