Figure 2.

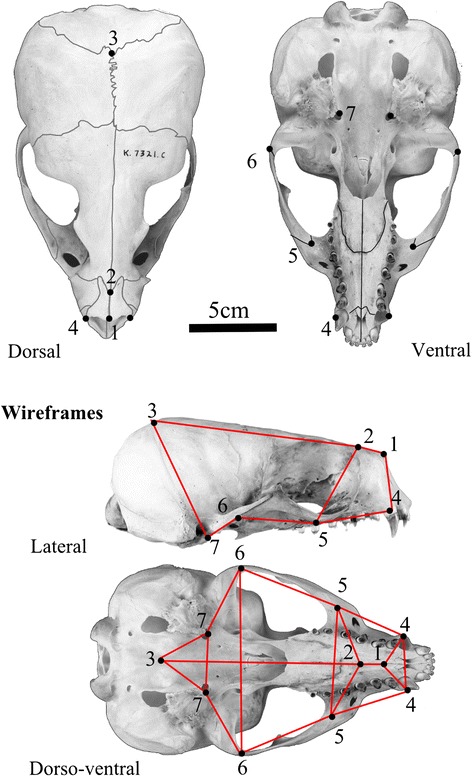
11 landmarks used in data analysis, shown on a skull of Arctocephalus gazella . Landmarks 4–7 were taken bilaterally. Landmark descriptions can be found in Table 2. Wireframe used to present shape variation from PCA shown in red.

11 landmarks used in data analysis, shown on a skull of Arctocephalus gazella . Landmarks 4–7 were taken bilaterally. Landmark descriptions can be found in Table 2. Wireframe used to present shape variation from PCA shown in red.