Figure 6.

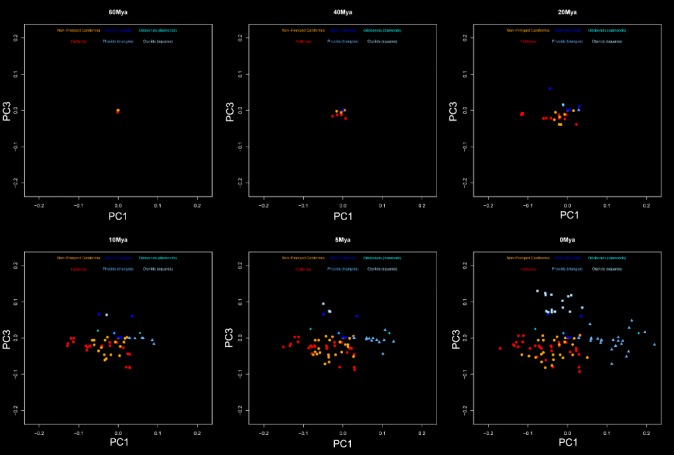
Evolutionary morphospace showing the reconstructed evolution of Carnivora on PC1 and PC3 through time. Based on IE analysis. Phylogeny and colors as shown in Figure 1. Points at the zero time point represent both nodes and tip values.

Evolutionary morphospace showing the reconstructed evolution of Carnivora on PC1 and PC3 through time. Based on IE analysis. Phylogeny and colors as shown in Figure 1. Points at the zero time point represent both nodes and tip values.