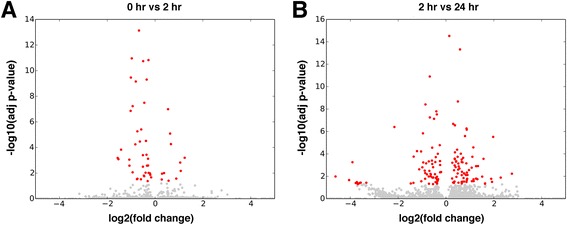
Figure 4.

M. angustirostris genes differentially expressed during an acute stress challenge. Genes differentially expressed during (A) acute stress (baseline (0 hr) versus 2 hr after ACTH administration) and (B) stress recovery (2 hr versus 24 hr after ACTH administration) conditions. Log2 fold change for each gene is shown on the x-axis, with -log10 adjusted p-value (false discovery rate < 0.05) on the y-axis. Genes that are differentially expressed at p < 0.05 are shown in red, with all other genes in grey.
