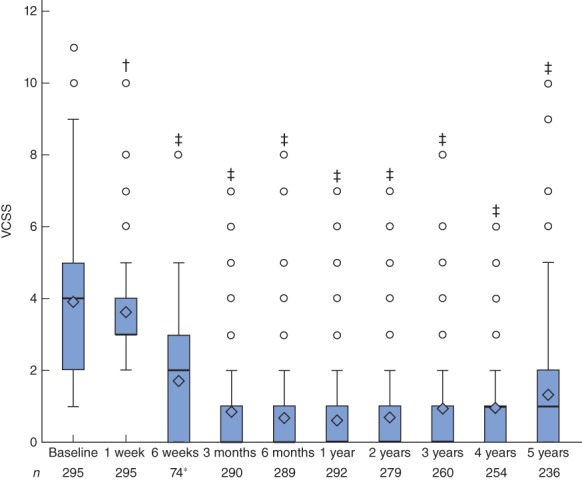
Figure 3.

Venous Clinical Severity Score (VCSS; range 0–30) before and after radiofrequency ablation for great saphenous vein reflux. Mean (diamond), median (line within box), i.q.r. (box), and range (error bar) excluding outliers (circles) are shown. *Six-week follow-up only for initially enrolled subjects. †P = 0·012, ‡P < 0·001 versus baseline (paired t test)
