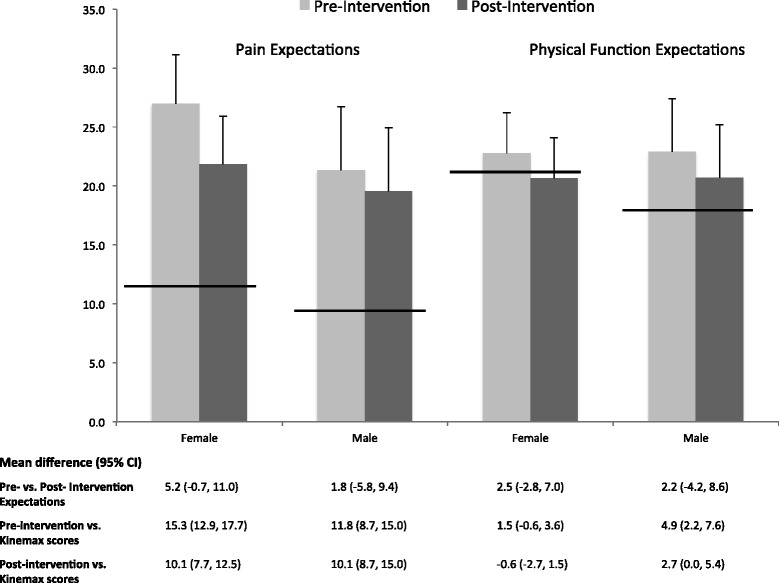
Figure 1.

Pre (light gray)- and post (dark gray)- intervention expectations on TKA outcomes versus reported 12-month post-TKA outcomes. Vertical bars describe female (n = 71) and male (n = 40) scores (mean ± 95% confidence interval) on adapted WOMAC expectation instrument with higher scores representing greater pain and poorer physical function. Thick horizontal lines describe mean 12-month post-TKA pain and physical function scores by gender from the US cohort of the Kinemax study [11].
