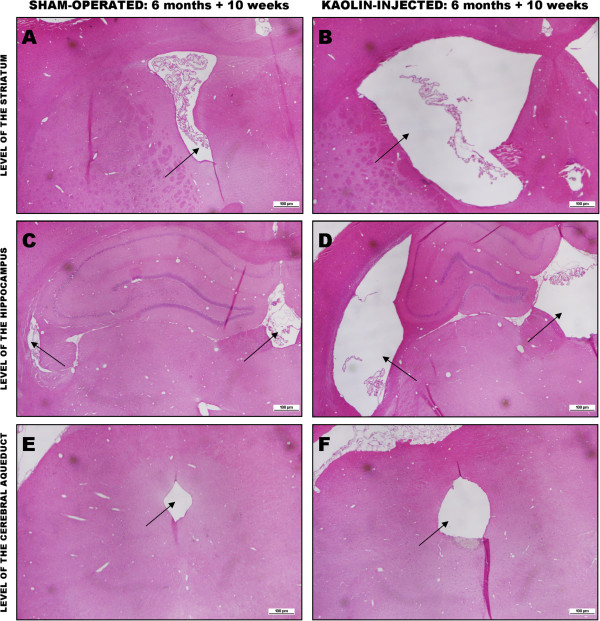
Figure 1.

Sections of sham-operated and kaolin-injected rats 10 weeks after injection. Comparison of a representative sham-operated tgAPP21 rat (left panels) to a representative kaolin-injected tgAPP21rat (right panels) at three different coronal brain levels: the level of the striatum (A & B), the level of the hippocampus (C & D), and the level of the cerebral aqueduct (E & F). Note the marked ventricular and aqueductal enlargement in the kaolin-treated tgAPP21 rat compared to sham-operated rat (arrows). H&E stain, ×10.
