
Figure 5.
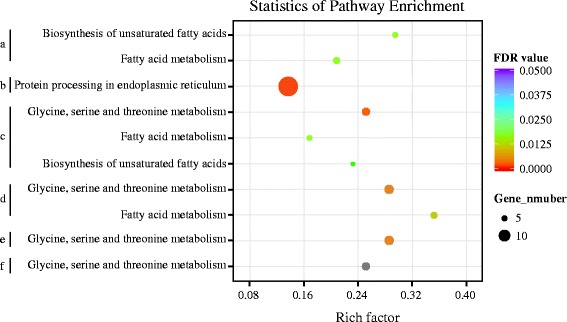
Scatterplot of enriched KEGG pathways for differentially expressed genes between any two silkworms. Rich factor is the ratio of the differentially expressed gene number to the total gene number in a certain pathway. The characters a, b, c, d, e, and f correspond to the comparisons D_CH vs D_CY, W_AKSQ vs W_AKBH, W_AKBH vs D_CH, W_AKBH vs D_CY, W_AKSQ vs D_CH, and W_AKSQ vs D_CY, respectively. The size and color of the dots represent the gene number and the range of the FDR value, respectively. The grey dot indicates a pathway that was not significantly enriched (the FDR value is 0.08).