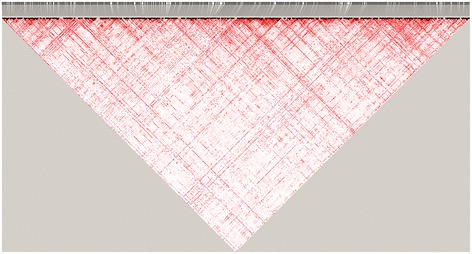
Figure 3.

Pattern of linkage disequilibrium (LD) of the genotypes simulated by GPOPSIM. Parameter setting for this simulation is Ne = 100, mutation rate u = 2.5 × 10⁻³, number of markers = 10,000. The pairwise LD among the first 1000 markers were shown in this figure.
