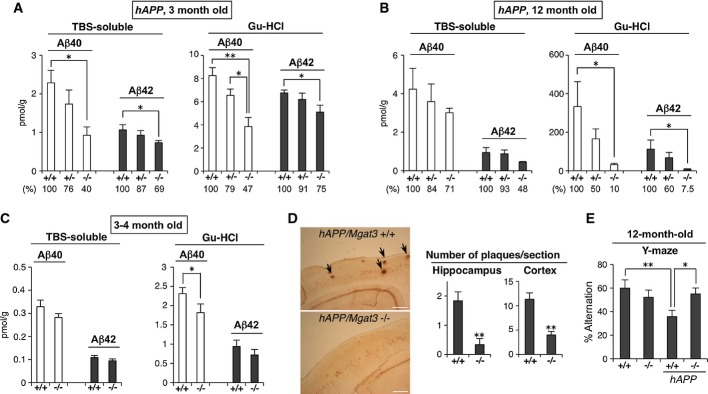
Figure 4.

- Amounts of Aβ40 or Aβ42 in the TBS-soluble or Gu-HCl-extractable fraction from (A) 3-month-old or (B) 12-month-old hAPP/Mgat3+/+, hAPP/Mgat3+/−, or hAPP/Mgat3−/− brains (n = 5). P = 0.015 for TBS Aβ40, P = 0.034 for TBS Aβ42, P = 0.001 and 0.012 for Gn–HCl Aβ40, P = 0.024 for Gn–HCl Aβ42 in (A), P = 0.040 for Gn–HCl Aβ40, P = 0.047 for Gn–HCl Aβ42 in (B).
- Amounts of Aβ40 or Aβ42 in the TBS-soluble or Gu-HCl-extractable fraction from 3- to 4-month-old Mgat3+/+ or Mgat3−/− brains (n = 7–8). An outlier value was rejected by the Smirnov–Grubbs' test (P < 0.05). P = 0.045 for Gn–HCl Aβ40.
- Immunostaining of Aβ plaques in 12-month-old mouse brain (left). Scale bar, 300 μm. The number of FSB-stained Aβ plaques in brain sections prepared from 12-month-old male mice was quantified (right) (n = 6). P = 0.004 for hippocampus, P = 0.0003 for cortex.
- The Y-maze test was performed using 12-month-old male Mgat3+/+, Mgat3−/−, hAPP/Mgat3+/+, or hAPP/Mgat3−/− mice (n = 8–10). **P = 0.004 for Mgat3+/+ versus hAPP/Mgat3+/+, *P = 0.022 for hAPP/Mgat3+/+ versus hAPP/Mgat3−/−.
Data information: All graphs show means ± SEM (*P < 0.05, **P < 0.01. For comparison between two groups, Student's t-test was used for (C) and (D) cortex, and Mann–Whitney U-test was performed for (D) hippocampus. In other cases, two-way ANOVA with a post hoc Tukey–Kramer test (A, B) or the Student–Newman–Keuls test (E) was used.
