
Figure 4.
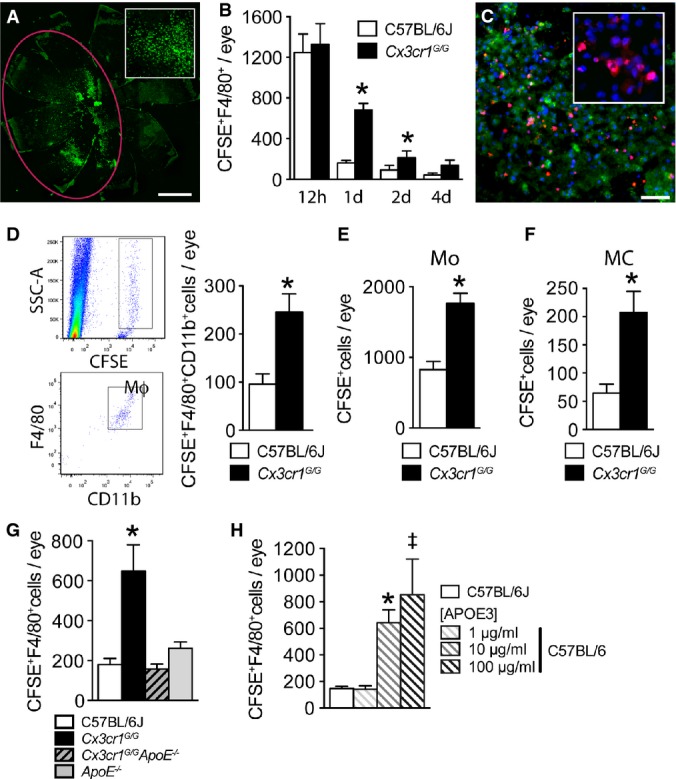
APOE inhibits subretinal MP clearance
- Representative image of a RPE flatmount 12 h after the subretinal injection (red marking) of 4 μl PBS with 12,000 CFSE-stained thioglycollate-elicited peritoneal cells that contain 70% macrophages (inset close-up view).
- Quantifications of CFSE+F4/80+ macrophages at different time points after subretinal injections of C57BL/6J and Cx3cr1GFP/GFP CFSE+ macrophages (n = 5/per group (12 h) and n = 6/per group thereafter; Mann–Whitney U-test, C57BL/6J versus Cx3cr1GFP/GFP: 1 day n = 20/group *P < 0.0001; 2 day n = 6/group *P = 0.0317).
- Representative image of TUNEL/Hoechst double-staining 12 h after subretinal injection of C57BL/6J CFSE+ macrophages (experiment repeated three times, inset close-up view).
- Representative cytometry images of SSC-A/CFSE and CD11b/F4/80 gated analysis of eye cell suspensions prepared 24 h after the injection of Cx3cr1GFP/GFP CFSE+ macrophages and cytometric quantification of eye cell suspensions at 24 h after the injection of C57BL/6J and Cx3cr1GFP/GFP macrophages into C57BL/6J (n = 16–20/group; Mann–Whitney U-test, *P = 0.0024).
- Quantification of subretinal CFSE+ cells on RPE and retinal flatmounts 24 h after subretinal injections of CFSE+ magnetic-bead-sorted bone marrow-derived monocytes (Mo) from C57BL/6J and Cx3cr1GFP/GFP mice into C57BL/6J mice (n = 8–12/group; Mann–Whitney U-test, *P = 0.0006).
- Quantification of subretinal CFSE+ cells on RPE and retinal flatmounts 24 h after subretinal injections of CFSE+CD11b FACS-sorted brain microglial cells from C57BL/6J and Cx3cr1GFP/GFP mice into C57BL/6J mice (n = 9–12/group; Mann–Whitney U-test, *P = 0.0087).
- Quantification of subretinal CFSE+F4/80+ macrophages on RPE and retinal flatmounts 24 h after subretinal injections of CFSE+ macrophages from C57BL/6J, Cx3cr1GFP/GFP, Cx3cr1GFP/GFPApoE−/−, and ApoE−/− mice into C57BL/6J mice (n = 8–12/group; one-way ANOVA/Dunnett test of Cx3cr1GFP/GFP versus any other group *P ≤ 0.0001; Mann–Whitney U-test, Cx3cr1GFP/GFP versus Cx3cr1GFP/GFPApoE−/− *P = 0.0006).
- Quantification of subretinal CFSE+F4/80+ macrophages on RPE and retinal flatmounts 24 h after subretinal injections of C57BL/6J CFSE+ macrophages into C57BL/6J and with exogenously added APOE3 at 1, 10, or 100 μg/ml calculated intraocular concentrations (n = 6–7/group; one-way ANOVA/Dunnett test: C57BL/6J versus 10 μg *P = 0.0488; C57BL/6J versus 100 μg ‡P = 0.006. Mann–Whitney U-test: C57BL/6J versus 10 μg *P = 0.0012; C57BL/6J versus 100 μg ‡P = 0.0013).
Data information: All primary cells were prepared from male mice; all recipient C57BL/6J mice were male. Mo: monocytes; MC: microglial cells; Mϕ: macrophages; SCC-A: side scatter detector A. Scale bars: 1 mm (A); 50 μm (C).