
Figure 2.
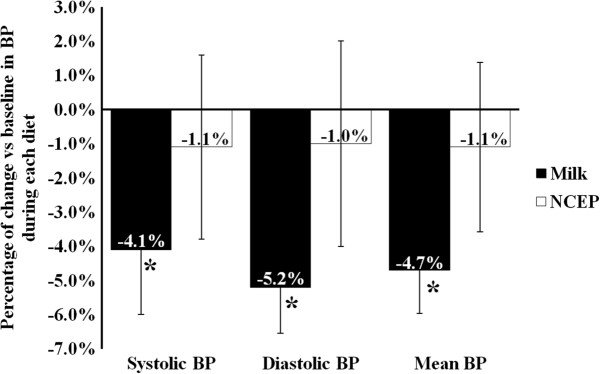
Changes from baseline in systolic, diastolic and mean blood pressure (BP) after the MILK and the control NCEP diets. Within and between-diet differences were tested by the MIXED procedure for repeated measurements using the change in blood pressures from baseline as dependent variables. *: Significant within-diet change (change from baseline, P < 0.05). Values are mean ± SEM. Diet-specific baseline values and changes in waist circumference were included as covariates in the models.