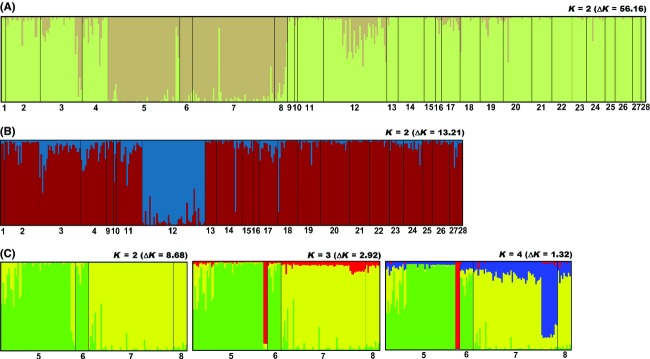
Figure 3.

Inferred populations structures for (A) the whole sample (448 individuals, 28 sampling populations, SPs) that was divided in the PEF group (light green) and the Western foothill lowland (WF) group (light brown); (B) STRUCTURE analysis performed only on the PEF group (323 individuals, 24 SPs) showed the presence of two clusters corresponding to SP12 (blue) and all the others SPs (dark red); (C) the three histograms of the WF group (125 individuals, four SPs) showed population structures with 2, 3, and 4 clusters, respectively (see Results). For K = 4, cluster 1 in green, cluster 2 in red, cluster 3 in yellow, and cluster 4 in blue. These colors correspond to those in Fig. 4. Each bar represents an individual and is colored (using DISTRUCT) according to CLUMPP individual probability of assignment (Qi) obtained from “No-admixture” models with “correlated allele frequencies” and LOCPRIOR information.
