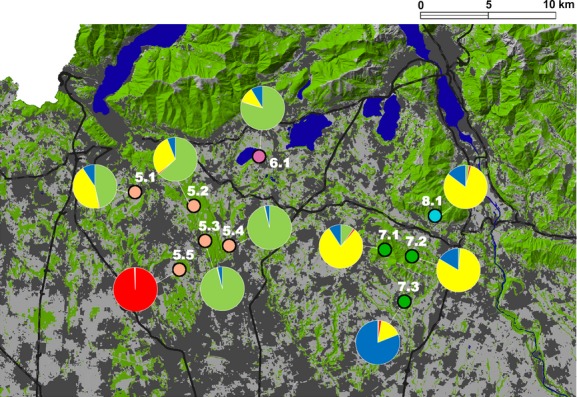
Figure 4.

Population structure of the Western foothill lowland (WF) group. Numbered dots indicate sampling locations, grouped according to their sampling population (dot colors). Pie charts represent the sampling location probability of assignment to the four clusters identified by running STRUCTURE. Cluster 1: green, cluster 2: red, cluster 3: yellow, and cluster 4: blue. These colors correspond to those in Fig. 3C with K = 4. In the background main land uses: forests in green, urban areas in dark–gray, farmland, and other open habitats in gray, lakes, wetlands, and rivers in blue. Black lines represent main roads.
