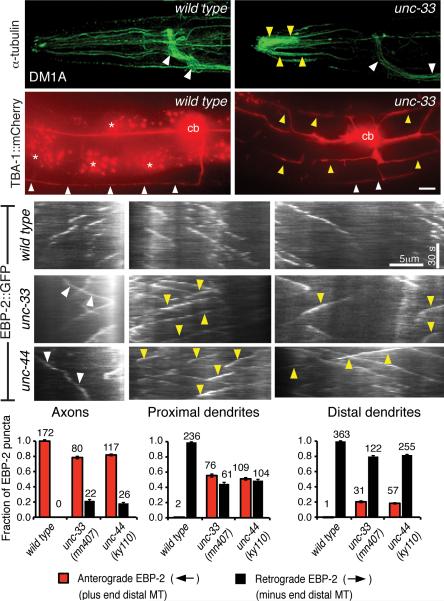
Figure 8. Microtubule defects in unc-33 and unc-44 mutants.
(a,b) Representative maximum intensity projections of confocal images of α-tubulin immunoreactivity in head neurons of wild type and unc-33(ky880) animals. White arrowheads indicate axon-rich nerve ring and ventral nerve cord, yellow arrowheads indicate distal sensory dendrites. unc-33(mn407) and unc-44(ky110) are shown in Supplementary Fig. 7, with quantification of immunostaining. (c,d) TBA-1::mCherry (α-tubulin) fluorescence in PVD neurons of representative wild type (c) and unc-33(mn407) (d) animals.
(e-g) Representative kymographs of moving EBP-2::GFP puncta in axons (e), proximal dendrites (f) and distal dendrites (g) of head neurons of wild type (top panel), unc-33(mn407) (middle) and unc-44(ky110) (bottom) animals. Time runs top to bottom; arrowheads mark mutant puncta moving against the normal direction for that process. Bar graphs show the fractions of puncta moving anterogradely and retrogradely with respect to the cell body. Error bars indicate s.e.p. Numbers above each column denote the number of puncta counted in the corresponding categories.

