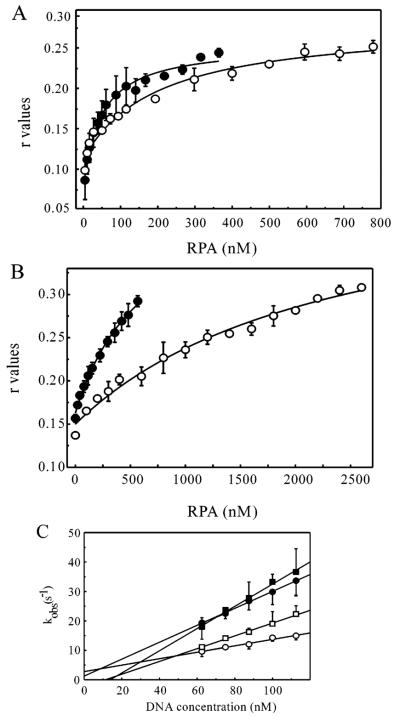
FIGURE 4.
Anisotropy and stopped-flow of RPA binding duplex DNA. DNA binding analysis of phosphorylated RPA on duplex DNA substrates. (A) Fluorescence polarization analysis of RPA (filled circles) and hyperphosphorylated RPA (open circles) binding to a duplex DNA containing a cisplatin 1,2 d(GpG) adduct. (B) Fluorescence polarization analysis of RPA (filled circles) and hyperphosphorylated RPA (open circles) binding undamaged duplex DNA. (C) Stopped-flow kinetic analysis of rhRPA and hyperphosphorylated RPA binding duplex 1,2d(GpG) and 1,3d(GpXpG) cisplatin damaged 30-mer DNA. The kinetic traces from 10 to 12 measurements were fit to a double exponential decay, and the observed rate constants for the fast phase of the reaction were plotted versus DNA concentration (62.5–112.5 nM). The plots of the 1,2d(GpG) (circles) and 1,3d(GpXpG) (squares) cisplatin-damaged DNA for rhRPA (filled symbols) and hyperphosphorylated RPA (open symbols) were fit to a straight line. Each point on the graph represents the average of three to four individual experiments, and the error bars represent the standard deviation.

