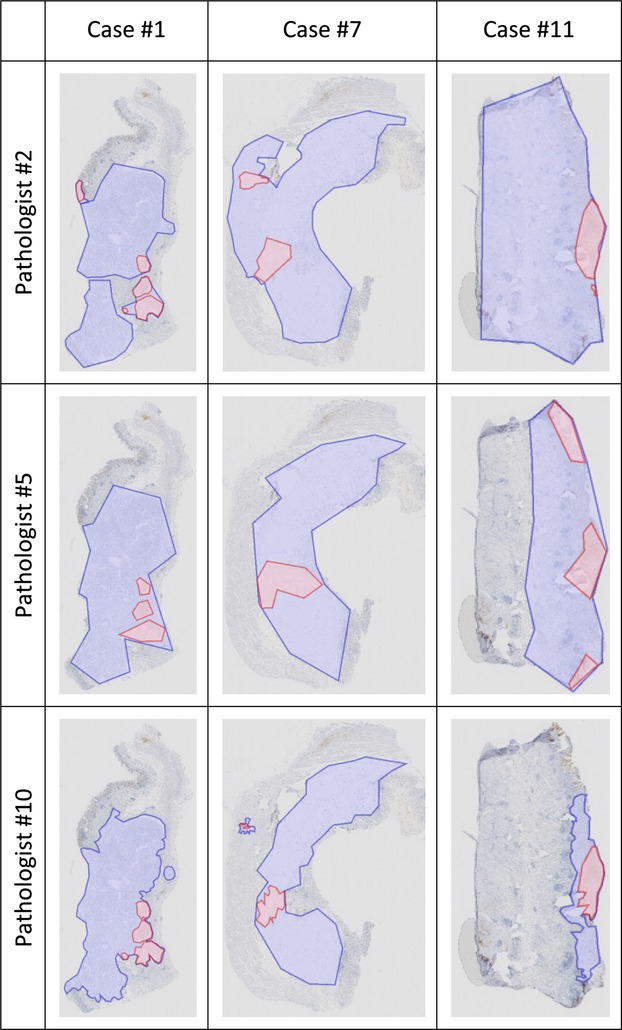
Figure 2.

Examples of the outlines of tumor areas (pale blue) and positive tumor areas (pale red) that were manually drawn by three pathologists. They illustrate the variations in assessment of positive tumor areas, and also of total tumor area. Full data are shown in Table S2B.
