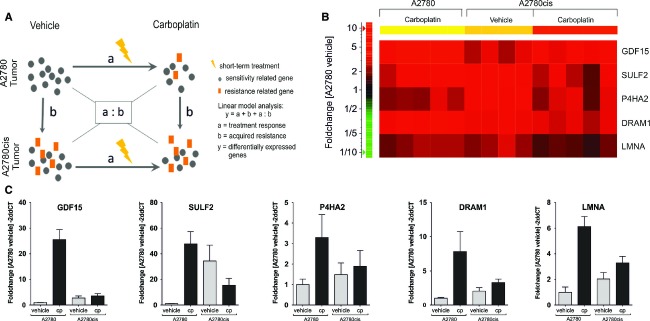
Figure 3.

Differential expression of resistance-related genes in carboplatin short-term-treated A2780 and A2780cis tumors identified by linear model analysis. (A) Schematic view of linear model analysis for identification of resistance-related genes. (B) Heat map of differentially expressed genes determined by Illumina bead chip array. Genes showing RNA fold change >twofold in carboplatin-treated A2780 and vehicle-treated A2780cis tumors compared to vehicle-treated A2780 tumors. (C) qRT-PCR analysis of GDF15, DRAM1, SULF2, P4HA2, and LMNA expression.
