Figure 6.
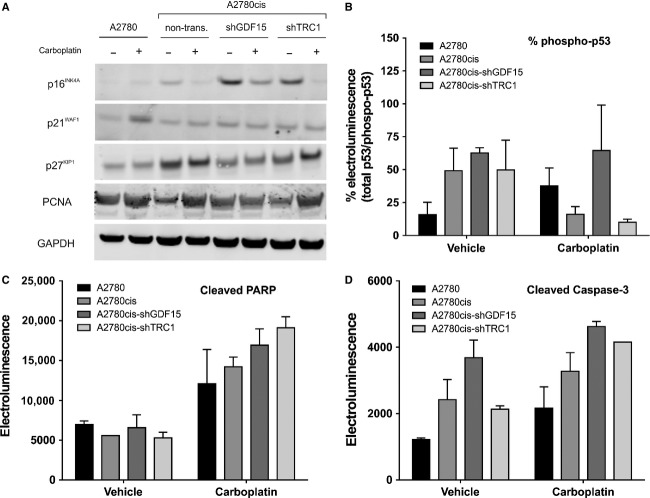
Apoptosis induction and cell cycle progression in A2780, A2780cis, shTRC1-, and shGDF15-A2780cis tumors after long-term carboplatin treatment. n = 3 tumors were pooled in each group. (A) Immunoblot of p16INK4A, p21Waf1/Cip1, p27Kip1, PCNA, and GAPDH. (B) Percent p53 activity measured by phospho-p53 normalized to total p53 electroluminescence. (C, D) Levels of cleaved PARP and cleaved caspase-3 measured by electroluminescence.

