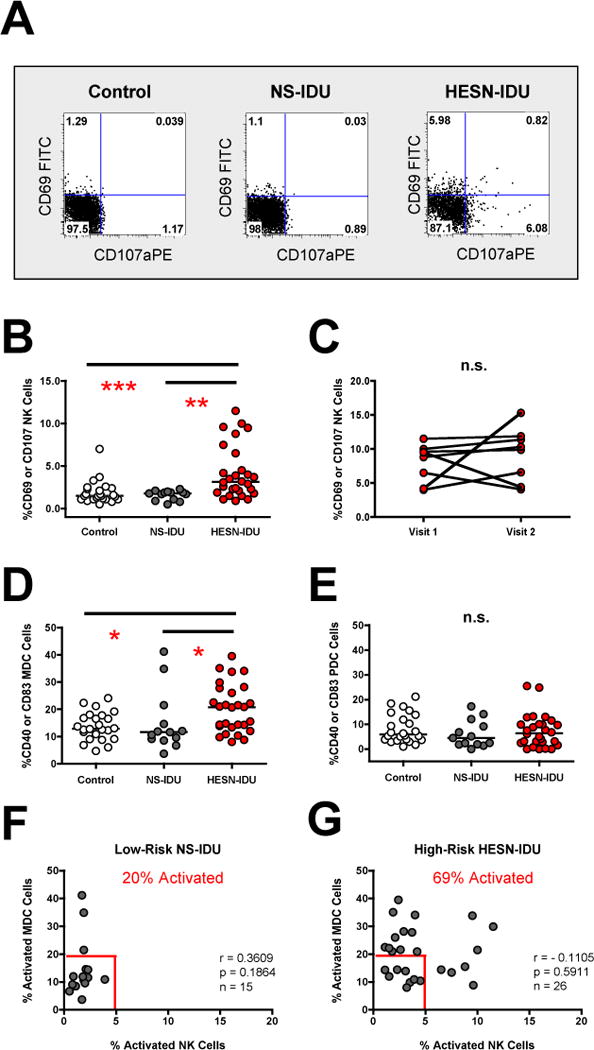
Figure 2. NK and MDC activation is increased in HESN-IDU subjects and associated with high-risk needle-sharing activity.

(A) PBMCs from a representative no-risk (control) donor, a low-risk non-sharing IDU (NS-IDU) subject and high-risk needle-sharing HESN-IDU subject were stained with fluorescently conjugated antibodies to NK phenotypic and activation markers. The frequency of constitutive CD107a (x-axis) and CD69 (y-axis) staining is shown on CD56+/CD3− gated lymphocytes with quadrant gates set based upon isotype control antibodies. (B) Composite graph of the constitutive CD69 activation and/or CD107a degranulation on CD56+/CD3− gated NK cells from no-risk control, low-risk NS-IDU and high-risk HESN-IDU subjects as depicted in panel A. (C) Constitutive NK CD69 activation and/or CD107a degranulation was measured longitudinally in 8 high-risk needle-sharing HESN-IDU subjects at multiple visits at least three months apart. (D–E) Composite graph of the constitutive CD40 activation and CD83 maturation on LIN−/HLA-DR+/CD11c+/BDCA-4− MDC cells (D) and LIN−/HLA-DR+/CD11c−/BDCA-4+ PDC cells (E) from no-risk control, low-risk NS-IDU and high-risk HESN-IDU subjects. (F–G) Composite graph of the constitutive NK cell activation (x-axis) and MDC activation (y-axis) in (F) low-risk NS-IDU subjects and (G) high-risk HESN-IDU subjects as described above. Frequency of individuals from each group staining positive for either NK or MDC activation is shown in red and gates were set based upon the 10th percentile of NK or MDC activation from control donors. Comparisons between three or more groups were performed using an unpaired, non-parametric Kruskal-Wallace ANOVA with a Dunn post-test. Statistical analysis of two groups was carried out using a Wilcoxon-Mann-Whitney test for two independent groups. Correlations between two variables were carried out using Spearman Correlation of untransformed data with a 95% confidence interval. In all cases, significant results have two-sided p values of p<0.05, p<0.01, p<0.001 denoted with a single, double or triple asterisk in graphs, respectively.
