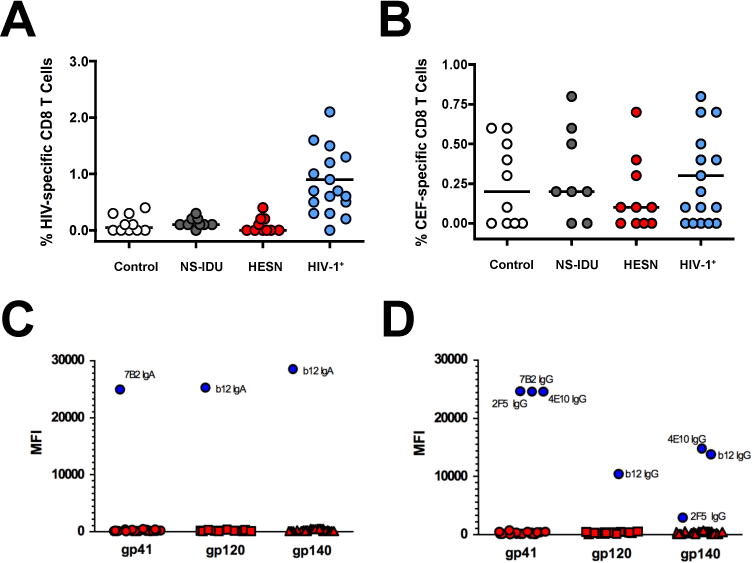
Figure 3. High-risk Needle-sharing Activity by HESN-IDU Subjects is Not Associated with Detectable HIV-specific CD8+ T cell or Antibody Responses.

(A–B) Composite graphs from controls, NS-IDU subjects, HESN-IDU subjects, and HIV-1 infected reference subjects showing the (A) HIV-specific CD8+ T cell response to peptide pools from the HIV-1 Gag protein or the (B) non-HIV-specific CD8+ T cell response to combined peptide pools from Cytomegalovirus, Epstein-Barr and Influenza Viruses (CEF). (C–D) Plasma samples from 28 high-risk HESN-IDU subjects and 14 low-risk non-sharing IDU control subjects were analyzed for HIV-1 specific responses utilizing a custom HIV-1 binding antibody multiplex assay (BAMA). HIV-1 specific IgA (C) and IgG (D) plasma antibodies to gp41 and Consensus gp120 and gp140 envelope antigens are shown as representative data. HIV-specific monoclonal antibodies 7B2 mAb (1 μg/ml), 4e10 mAb (50 μg/ml), 2F5 mAb (16 μg/ml) and b12 mAb (20 μg/ml) were used as positive controls in addition to a HIV-IG titration curve (500 μg/ml titrated 6-fold, 10 places). Each sample was analyzed in two independent BAMA assays and HESN-IDU samples were defined as positive for a specific antigen if the sample MFI was greater than the average mean fluorescent intensity (MFI) plus 5 standard deviations of the panel of non needle-sharing IDU control subjects. Statistical analysis carried out as described in Figure 2.
