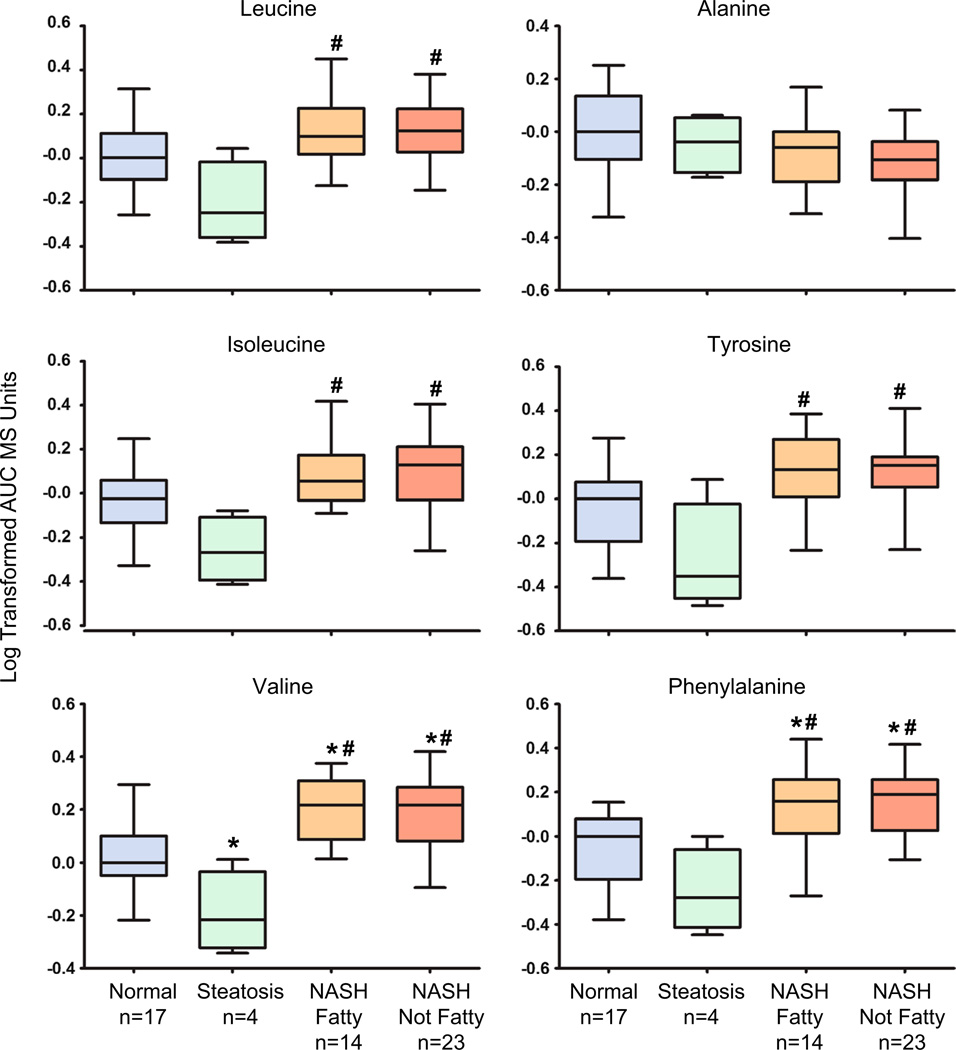
Fig. 3.
Metabolomic composition of hepatic amino acids in progressive stages of human NAFLD. The metabolomics profiling results for the BCAAs leucine, isoleucine and valine with the amino acids tyrosine, alanine, and phenylalanine are shown as log-transformed area under the curve (AUC) mass spectrometry units normalized to the median value of the normal samples ± the standard deviation. Significance from normal is shown by asterisk and significance from steatosis is represented by pound. Significance set at p ≤ 0.05

