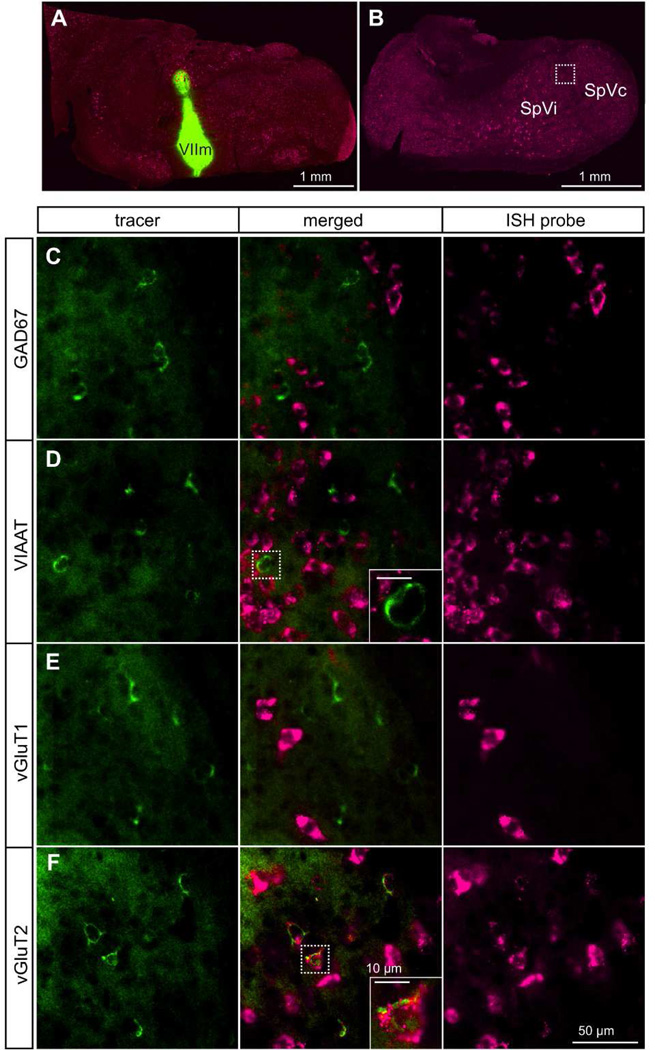
Figure 8. Neurotransmitter phenotype of SpVm neurons.
A: Representative injection in VIIm of CTb (green) with a sample ISH probe (red) for contrast. B: Example location in SpVm for neuron counting (box). (c–d) Sample ISH of inhibitory neuron transcripts for g-aminobutyric acid (GAD67) (c) and vesicular inhibitory amino acid transporter (VIAAT) D: Inset in panel D to assess colocalization of tracer and probe (under 40× magnification confocal). E–F: Sample ISH of excitatory neuron transcripts for vesicular glutamate transporter 1 (vGluT1; panel E) and vesicular glutamate transporter 2 (vGluT2; panel F). Inset in panel F to assess colocalization of tracer and probe, scale bar 10 µm (under 40× magnification confocal).

