Fig. 2.
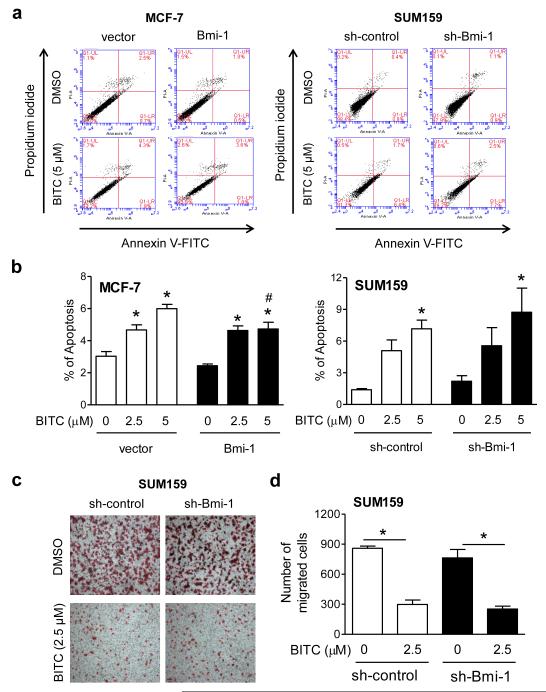
Bmi-1 is largely dispensable for BITC-induced apoptosis or cell migration inhibition. a Representative flow histograms depicting apoptotic fraction in the indicated cells after 24 h treatment with DMSO or BITC. b The bar graphs show quantitation of apoptotic fraction. Results are expressed as mean ± SD (n = 3). Significantly different (P<0.05) compared with *respective DMSO-treated control, and # between empty vector transfected control and Bmi-1 overexpressing MCF-7 cells by one-way ANOVA followed by Bonferroni’s multiple comparison test. c Representative migration images (Boyden chamber assay) after 24 h treatment with DMSO or BITC (100× magnification). d Quantitation of cell migration. Results shown are mean ± SD (n = 3). *Significantly different (P<0.05) between the indicated groups by one-way ANOVA followed by Bonferroni’s multiple comparison test.

