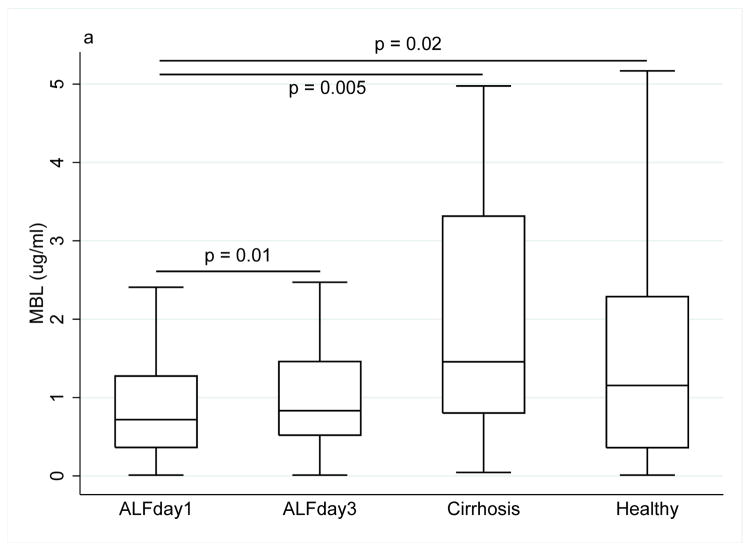
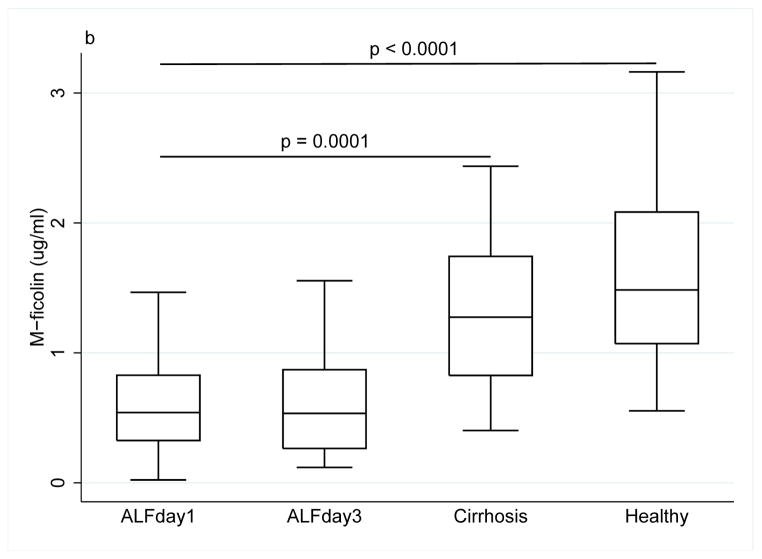
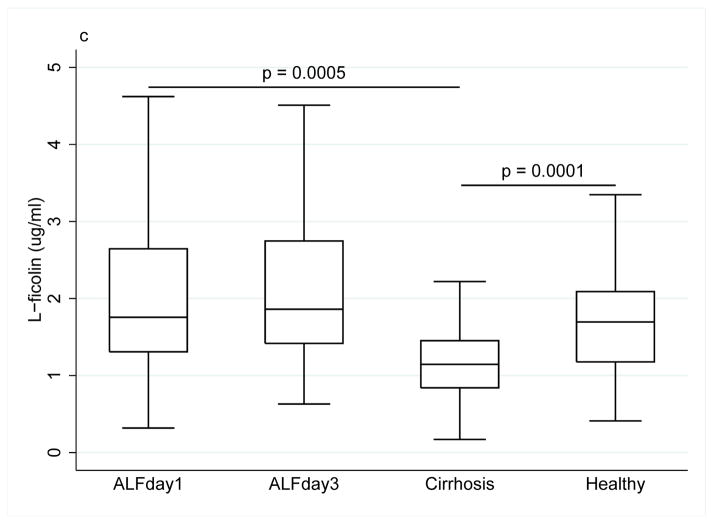
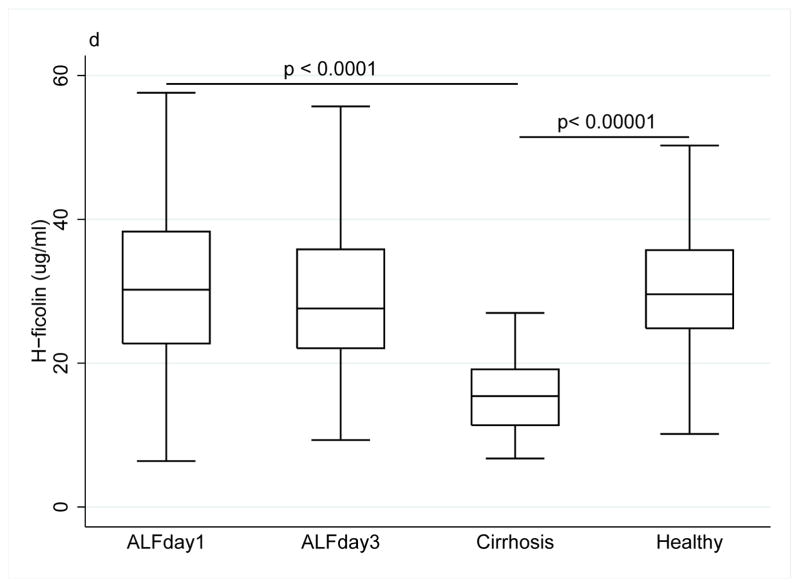
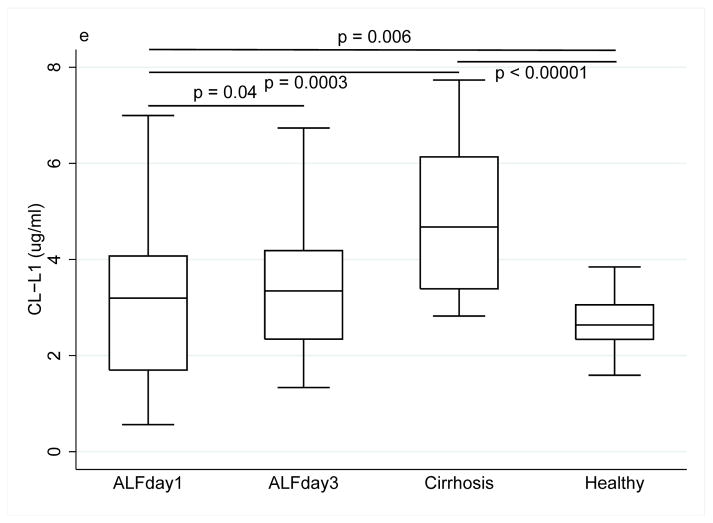
Figure 1.
Collectin and ficolin levels ((a) MBL, (b) M-ficolin, (c) L-ficolin), (d) H-ficolin, (e) CL-L1) in patients with acute liver failure on day 1 and 3 of enrolment, patients with stable alcoholic cirrhosis and healthy blood donors. The box plots represent median and 25–75 percentiles. Upper and lower lines are the upper and lower adjacent values.

