Figure 2.

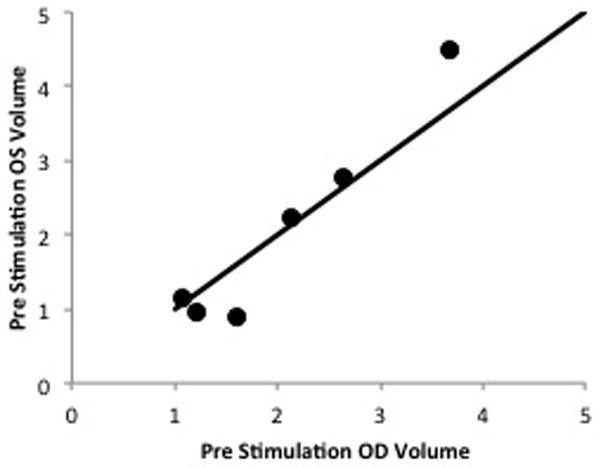
Scatter plot graph comparing baseline (pre-stimulation) tear volumes of the right and left eyes. No statistical difference was demonstrated by the Wilcoxon non-parametric test (p=0.75).

Scatter plot graph comparing baseline (pre-stimulation) tear volumes of the right and left eyes. No statistical difference was demonstrated by the Wilcoxon non-parametric test (p=0.75).