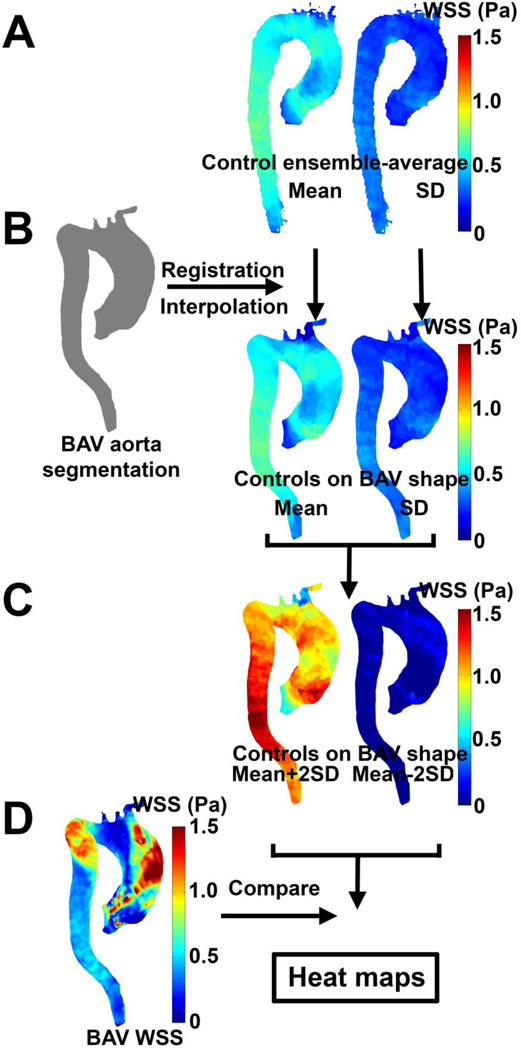
Figure 1.
Generation of WSS heat maps. (A) The control population-averaged mean and SD WSS maps were registered and interpolated to the aorta segmentation of the BAV patient (B). (C) The mean ± 1.96 times SD maps are created and compared with the peak systolic WSS of the BAV patients resulting in the heat maps (D).

