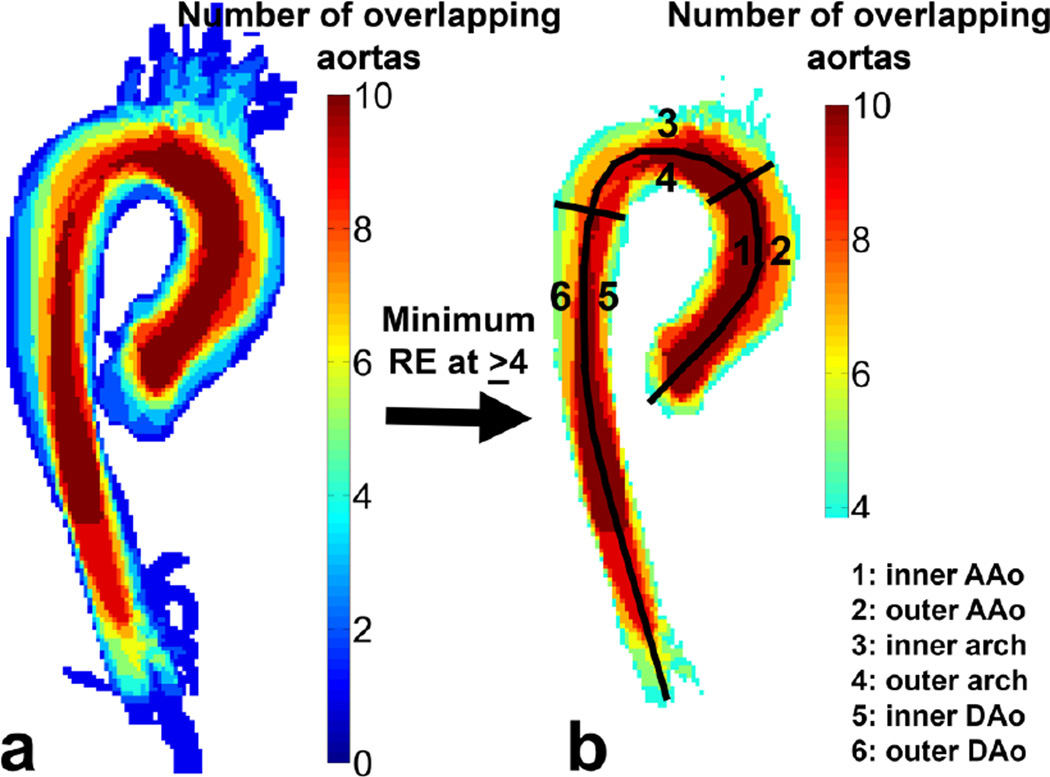
Figure 4.
(a) A map representing the overlap of all 10 control aortas. (b) The idealized geometry is the overlap map where the overlap is maximized over the subjects: in this case where more than 4 aortas are overlapping. The six regions where the difference in velocity before and after interpolation and the percentage of surface area with abnormal WSS was calculated is shown in (b) as well: 1) Inner curvature AAo, 2) Outer curvature AAo, 3) Inner curvature Arch, 4) Outer curvature Arch, 5) Inner curvature DAo and 6) Outer curvature DAo.

