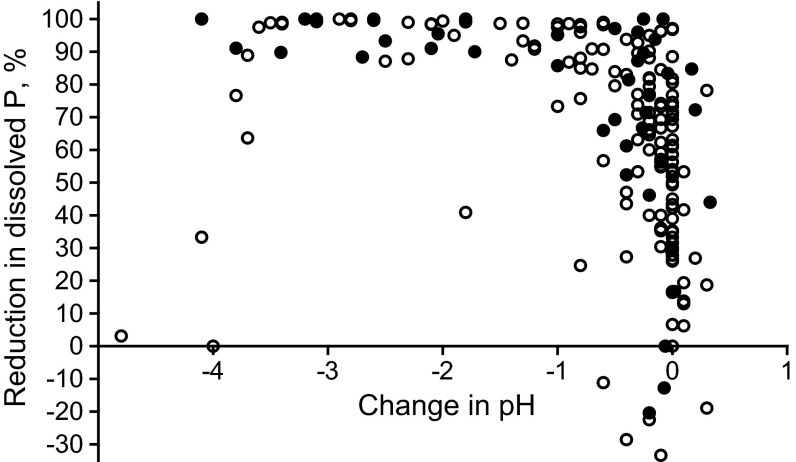
Fig. 4.
Reduction in dissolved P concentration (as a result of ferric sulfate application) as a function of pH change in water (from about neutral pH at all sites). The graph shows results of all sites and samplings; closed symbols for DRP and open symbols for TDP. Reduction based on concentration difference in samples taken upstream and downstream of dispenser units

