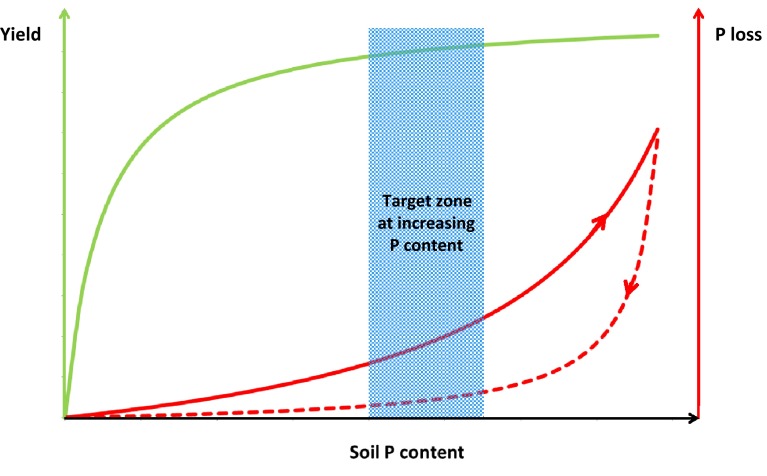
Fig. 4.
Conceptual representation of yield and phosphorus (P) loss at increasing soil P content (solid lines) and associated optimal agro-environmental target zones, according to Tunney (2002). Dotted line represent the expected P loss at decreasing soil P content due to mining according to Schoumans and Chardon (2015)

