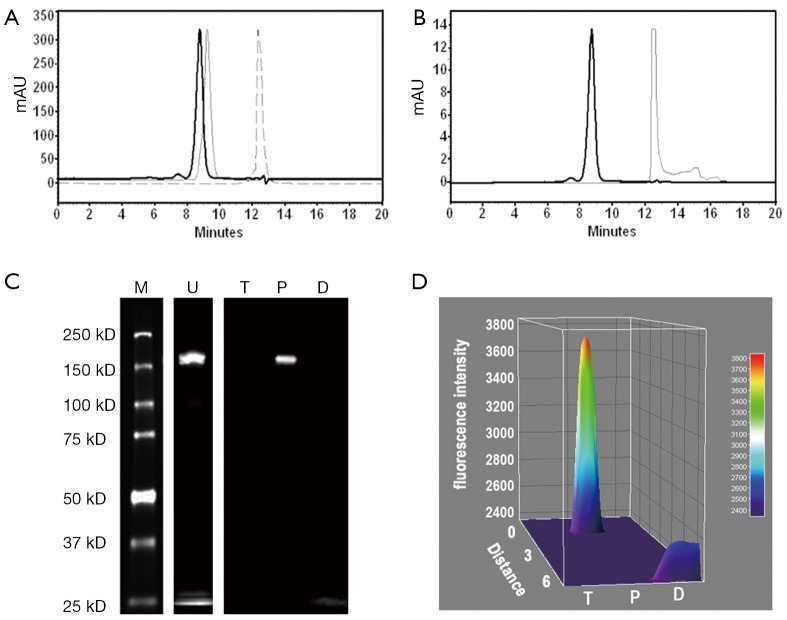
Figure 2.
Purity analysis of DTPA-trastuzumab-IRDye 800 via SE-HPLC and SDS-PAGE. (A) Overlapping chromatograms of DTPA-trastuzumab-IRDye 800 (solid bold line, Rt =8.80 min), trastuzumab (solid thin line, Rt =9.26) and DTPA (dotted line, Rt =12.39 min) at 280 nm by SE-HPLC; (B) SE-HPLC chromatograms of DTPA-trastuzumab-IRDye 800 (solid bold line, Rt =8.80 min) and IRDye 800CW (solid thin line, Rt =12.51 min) at 780 nm; (C) SDS-PAGE analysis of unpurified and purified DTPA-trastuzumab-IRDye 800 using a LI-COR Odyssey infrared imaging system with trastuzumab and IRDye 800 as negative and positive controls, respectively; (D) fluorescence intensity surface plot of trastuzumab, purified DTPA-trastuzumab-IRDye 800 and IRDye 800. M, protein molecular weight ladder; U, unpurified DTPA-trastuzumab-IRDye 800; T, trastuzumab; P, purified DTPA-trastuzumab-IRDye 800; D, IRDye 800.

